

Paper & Workflow
GPT-4o transcribes 2,576 bird specimen labels from 1929-31; on 130 hand-checked labels it scores 95 out of 100 for text similarity
Peter Learned, Ken Norris and colleagues at the Natural History Museum in London, with the American Museum of Natural History, photographed the labels on bird specimens from a 1929-31 Madagascar expedition with a phone, had GPT-4o transcribe them, turned the place names into coordinates and drew historical maps for four endemic species. Against 130 labels transcribed separately by two people and reconciled, the final prompt scored 95.25 on average for text similarity. The score was measured on the same labels the prompt was tuned on, and handwritten place names fared clearly worse than typed ones.
●Paper + hand-checked sample + illustrative maps
Current boundary: The score is text similarity, not the share of fields fully right; it was measured on the labels used for tuning; placing specimens took manual fixes; the maps are illustrative
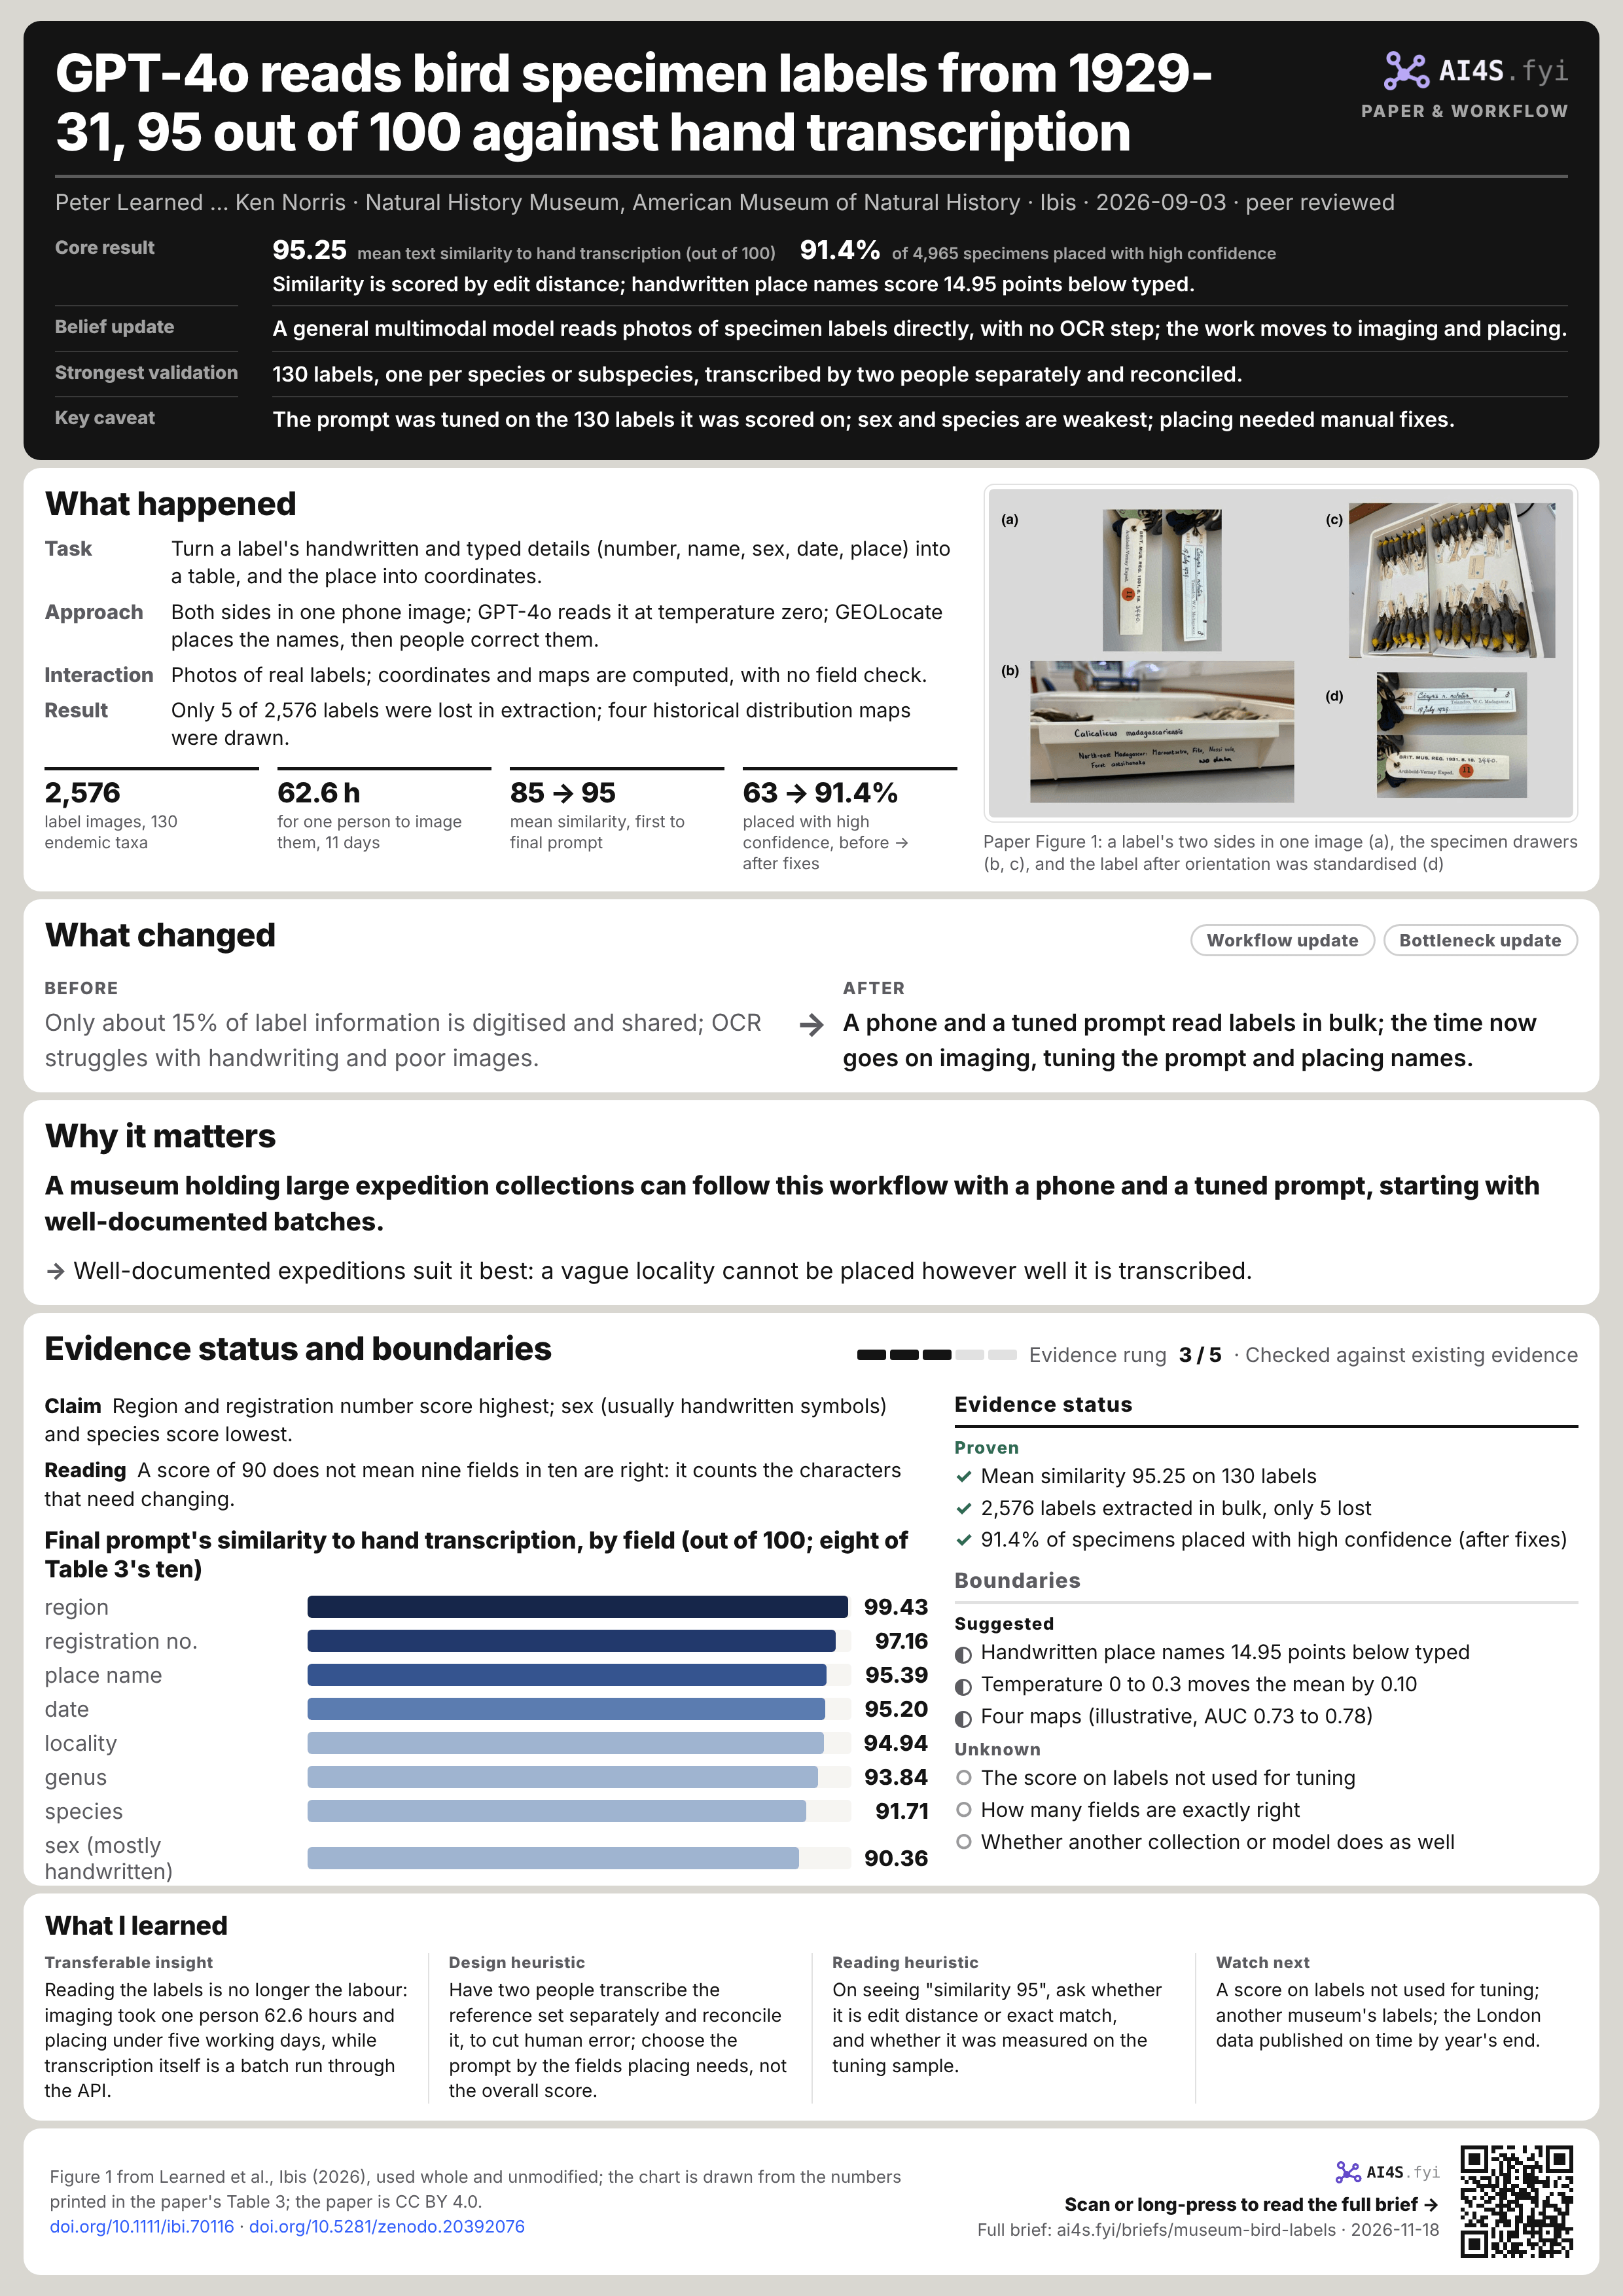
95.25mean text similarity to hand transcription (out of 100)
91.4%of 4,965 specimens placed with high confidence
Similarity is scored by edit distance; handwritten place names score 14.95 points below typed.
- Belief update
- A general multimodal model reads photos of specimen labels directly, with no OCR step; the work moves to imaging and placing.
- Strongest validation
- 130 labels, one per species or subspecies, transcribed by two people separately and reconciled.
- Key caveat
- The prompt was tuned on the 130 labels it was scored on; sex and species are weakest; placing needed manual fixes.
01What happened
- Task
- Turn a label's handwritten and typed details (number, name, sex, date, place) into a table, and the place into coordinates.
- Approach
- Both sides in one phone image; GPT-4o reads it at temperature zero; GEOLocate places the names, then people correct them.
- Interaction
- Photos of real labels; coordinates and maps are computed, with no field check.
- Result
- Only 5 of 2,576 labels were lost in extraction; four historical distribution maps were drawn.
2,576label images, 130 endemic taxa
62.6 hfor one person to image them, 11 days
85 → 95mean similarity, first to final prompt
63 → 91.4%placed with high confidence, before → after fixes
The paper was published online on 3 September 2026 in Ibis, the British Ornithologists' Union's journal, under CC BY 4.0. Its seven authors are at the Natural History Museum in London (South Kensington and Tring) and the American Museum of Natural History in New York; the corresponding author, Ken Norris, is the London museum's Research Leader in Biodiversity Change, and the first author, Peter Learned, contributed to the conception, methods, data, analysis and software, shared with Norris and others. The paper reports no specific funding and no conflict of interest. Scripts and prompt documentation are on Zenodo; the London data are to go on the museum's Data Portal by the end of 2026, and the New York data are available from the museum on request.[S1][S2][S3]
Why this expedition
The Archbold-Vernay Expedition collected about 7,500 bird specimens of more than 150 species in Madagascar in 1929-31, split roughly equally between London and New York, each with fairly detailed location information. The authors say the size makes manual transcription hard; the labels mix handwriting, type and the symbols for male and female; and with over 100 endemic species or subspecies among about 250 native birds, and 15% of species threatened, the historical records have ecological value. New York had transcribed its half of the registers by hand some years earlier; London had no digital record, so the authors first built a species and registration list from its registers to find the specimens. Imaging and model transcription therefore used London's specimens only, and the two museums' data were combined for placing and mapping.[S1]
Imaging: one phone, 11 working days
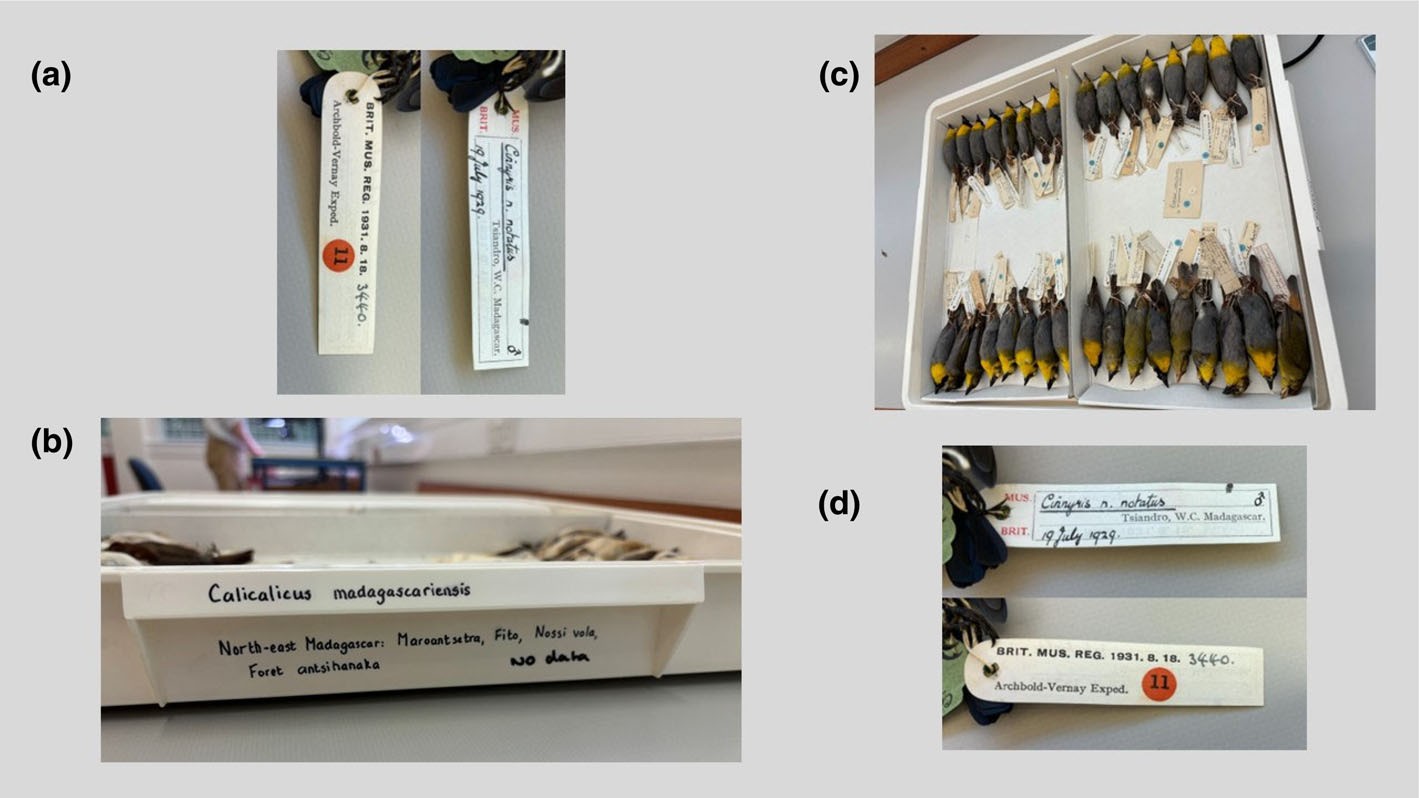
Both sides of a label carry information. Images were taken at 1080 pixels on an iPhone 15 Plus, using the free split-screen layout of Instagram's camera to put the front and back into one picture; to save time labels were not straightened first, and a Python script standardised their orientation afterwards. Each batch began with a photo of the drawer label, to make specimens easy to find again. One person took 62.6 hours over 11 working days to capture 2,729 images, about 44 an hour overall (Table 1's mean of daily rates is 47, counting duplicates and drawer shots); 2,576 were kept after duplicates and unusable shots were removed.[S1]
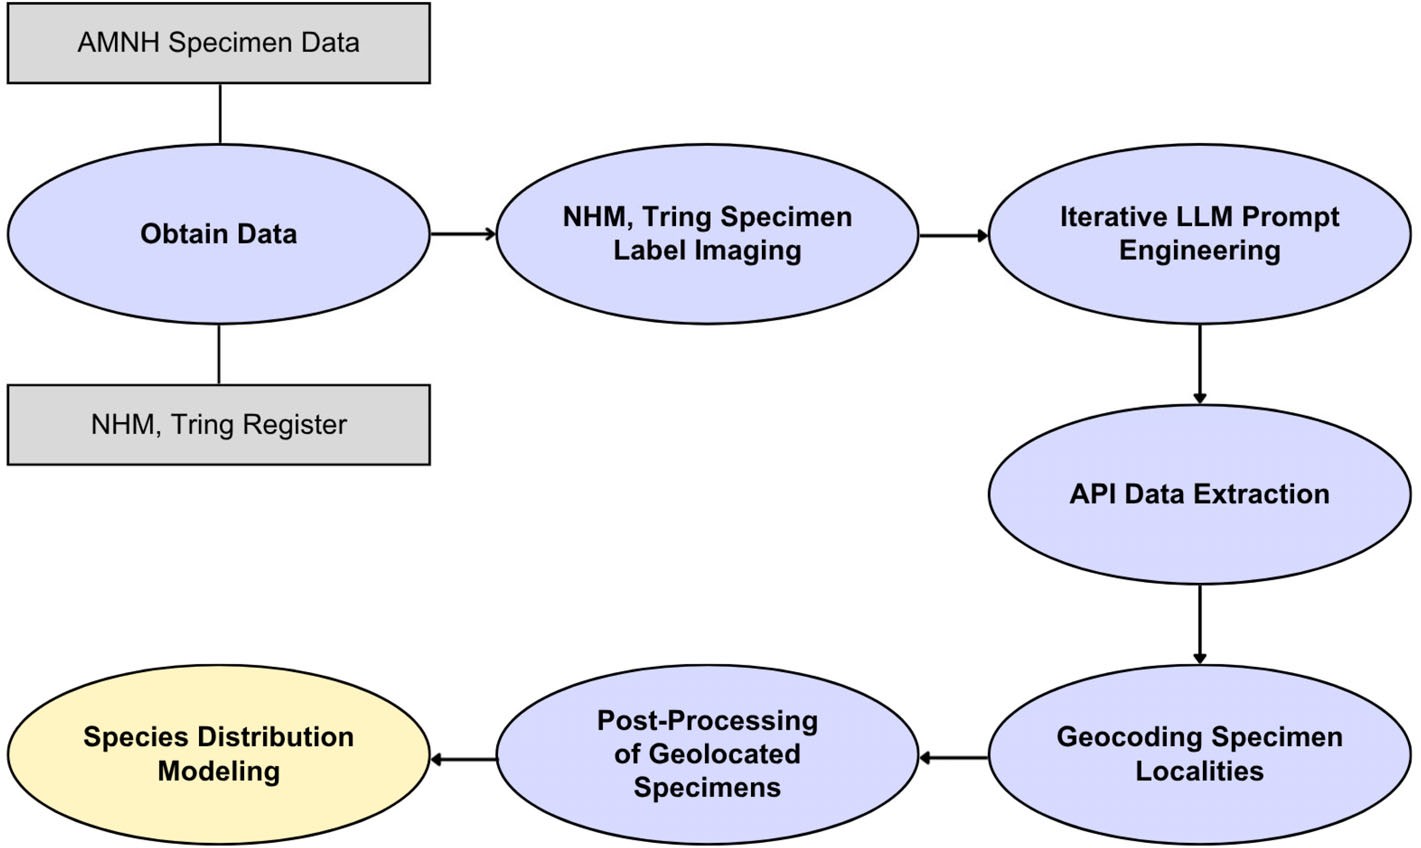
Figure 2: the seven stages. Gather both museums' specimen records, image the labels at Tring, tune the prompt, extract in bulk through the API, geocode the localities, correct them by hand, and model species distributions. [S1]
02What changed
Workflow updateBottleneck updateOnly about 15% of label information is digitised and shared; OCR struggles with handwriting and poor images.
A phone and a tuned prompt read labels in bulk; the time now goes on imaging, tuning the prompt and placing names.
Tuning the prompt: from 85 to 95
The start was a ChatGPT-4o prototype prompt written earlier at the London museum for specimen labels (v1.1). After each edit the model read the 130 labels through OpenAI's API, called from Google Colab with an API key bought for about $10, and its output was scored against the hand transcription. The prototype averaged 85.18, with 0 for sex; one intermediate version, v1.3, fell to 56.26. Three versions, v1.4, v1.6 and v2.2, averaged above 95. v1.6 scored highest (95.48), but the authors chose v2.2 (95.25) because it was most accurate on locality and place name, the fields geocoding needs. v2.2 runs to 253 words and asks for verbatim transcription. Raising the temperature from 0 to 0.3 moved the mean by only 0.10.[S1]
Placing: 63% automatically, 91.4% after manual fixes
Locality, place name and region were joined into one string (for example "1 mi N Ivohibe Madagascar") and sent in batches to GEOLocate, a web tool from Tulane University's natural history museum, which returns coordinates and a confidence score from 0 to 100; 80 or more counts as high confidence. The first pass reached that for 63%. Manual fixes followed: misspelt place names corrected, French names changed to English, and phrases such as "3 days west of" a place rewritten as kilometres, using distances estimated from the 1936 account by Austin Rand, the expedition's lead ornithologist. After that 91.4% had high confidence, 5.8% had coordinates at low confidence and 2.8% could not be found, mostly descriptions too vague to place, such as "scrubby forest" or "calcareous forest". The authors put the manual work at under five working days. Sorting by date also exposed place names the model had misread, since the expedition was in one place on a given day.[S1]
03Why it matters
A museum holding large expedition collections can follow this workflow with a phone and a tuned prompt, starting with well-documented batches.
- Well-documented expeditions suit it best: a vague locality cannot be placed however well it is transcribed.
By the estimate the authors cite, about 15% of the information on specimen labels has been digitised and shared, mostly because digitising and placing each specimen costs time and money. The authors call the 4,965 specimens digitised and geocoded a significant addition to the 5,876 Madagascar birds of 1925-35 listed on VertNet; of them, the 2,571 London specimens compare with 190 from that collection on VertNet. With 6.6 million preserved bird specimens listed on VertNet, they say workflows like this could in principle have a major impact on digitising birds and other groups, but that the prompts must be adjusted and re-tested for accuracy on each new collection. They also note that large language models make mistakes and occasionally invent information, and that asking for verbatim transcription helps reduce this.[S1]
The maps were drawn with the free MaxEnt software for four endemic species: Coua caerulea, Accipiter francesiae, Pterocles personatus and Cinnyris sovimanga. Environmental variables were land use and population for 1930 from HYDE 3.3 and precipitation and temperature for 1929-31 from CRU TS 4.07, alongside WWF's present-day ecoregions and elevation. Sampling bias was estimated crudely from the number of specimens collected at each place. The four models' test AUC ran from 0.730 to 0.778 (Table 4), which the authors call moderate, from 14 to 41 unique collection points per species. The authors say the maps should be regarded as illustrative rather than definitive, but that they are among the earliest distribution maps for the island's endemic birds, about 60 years before BirdLife International's Endemic Bird Area work.[S1]
04Evidence status and boundaries
Evidence rung 3 / 5 · Checked against existing evidenceEvidence status
Proven
- Mean similarity 95.25 on 130 labels
- 2,576 labels extracted in bulk, only 5 lost
- 91.4% of specimens placed with high confidence (after fixes)
Boundaries
Suggested
- Handwritten place names 14.95 points below typed
- Temperature 0 to 0.3 moves the mean by 0.10
- Four maps (illustrative, AUC 0.73 to 0.78)
Unknown
- The score on labels not used for tuning
- How many fields are exactly right
- Whether another collection or model does as well
ClaimRegion and registration number score highest; sex (usually handwritten symbols) and species score lowest.
Final prompt's similarity to hand transcription, by field (out of 100; eight of Table 3's ten)
ReadingA score of 90 does not mean nine fields in ten are right: it counts the characters that need changing.
How the score is computed.
The reference set is one randomly chosen image per endemic species or subspecies, 130 in all, transcribed separately by two people, compared by text similarity, with the differences corrected against the photo. Similarity comes from the fuzzywuzzy package: the number of single-character insertions, deletions or substitutions needed to turn one text into the other (edit distance), normalised to a score from 0 to 100. The authors set an average of 95 or more across fields as high accuracy. So 95.25 is the mean of ten fields' similarity scores, not the share of labels or fields transcribed exactly right, which the paper does not report. Every version of the prompt was tested and revised on these 130 labels and the best performer on them was chosen; the paper does not re-test on a separate set of unseen labels.[S1]
What affects accuracy.
Linear models on v2.2 show accuracy differing significantly between labels and between fields, with sex and species name clearly more error-prone. Mixed models of label features find no significant effect of staining, low light or blur (P > 0.17), but handwritten locality information scores 14.95 points below typed (P = 1.38e-05). The authors explain that sex is usually written by hand with male and female symbols in varying positions, the hardest data to read; and that some species-name "errors" are the model writing out an abbreviated name in full (Neomixis t. decaryi as Neomixis tenella decaryi), technically wrong but of little consequence for the data.[S1]
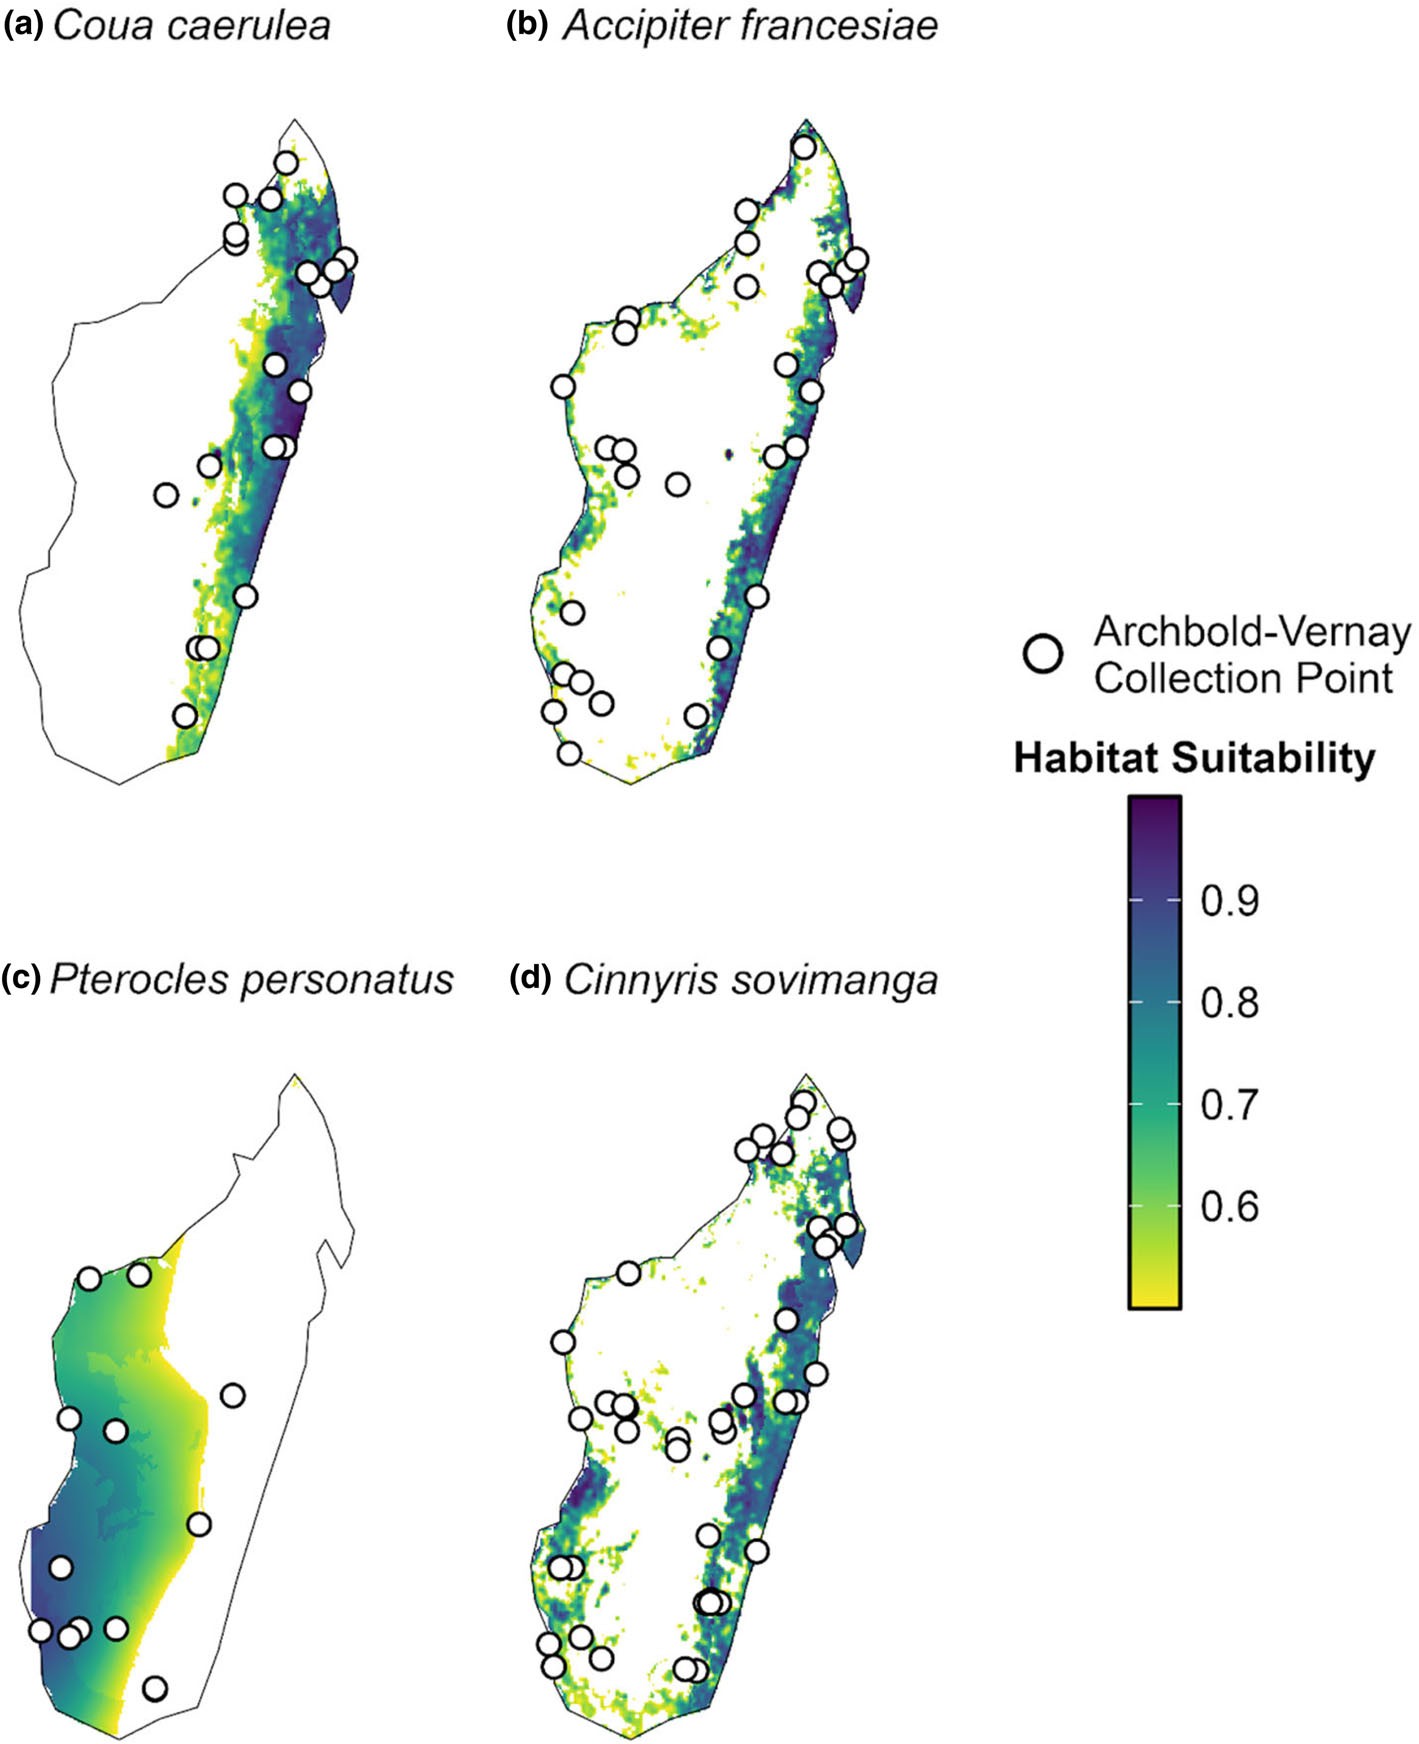
Figure 4: habitat suitability for four endemic species, from yellow (0.5) to dark purple (1.0); white circles are the expedition's collection points. The authors call the maps illustrative. [S1]
05What I learned
- Transferable insight
- Reading the labels is no longer the labour: imaging took one person 62.6 hours and placing under five working days, while transcription itself is a batch run through the API.
- Design heuristic
- Have two people transcribe the reference set separately and reconcile it, to cut human error; choose the prompt by the fields placing needs, not the overall score.
- Reading heuristic
- On seeing "similarity 95", ask whether it is edit distance or exact match, and whether it was measured on the tuning sample.
- Watch next
- A score on labels not used for tuning; another museum's labels; the London data published on time by year's end.
As one imageTo save and share→Sources
Factual claims link to original announcements, project lists, trial records or journal papers where possible. Research plans are kept separate from completed results.