

Preprint & Model
Google DeepMind's OCELOT maps where 100,000 species occur; satellite embeddings lift its held-out score by 51%
Bart van Merriënboer, Drew Purves and five colleagues at Google DeepMind and Google Research trained a model on 2 billion sightings from GBIF, the open biodiversity database: given a place, it estimates which of 100,000 species a record there belongs to. Tested on blocks up to 600 km wide held out of training, adding AlphaEarth Foundations satellite embeddings raised its ranking score from 0.076 to 0.115. Every result is the authors' own test, in a preprint not yet reviewed, and the weights are not yet released.
●Preprint + held-out regions + range-map benchmarks
Current boundary: It predicts relative occurrence, not presence or abundance; it ignores seasons and migration; it is untested on real sensor deployments; the weights are not released
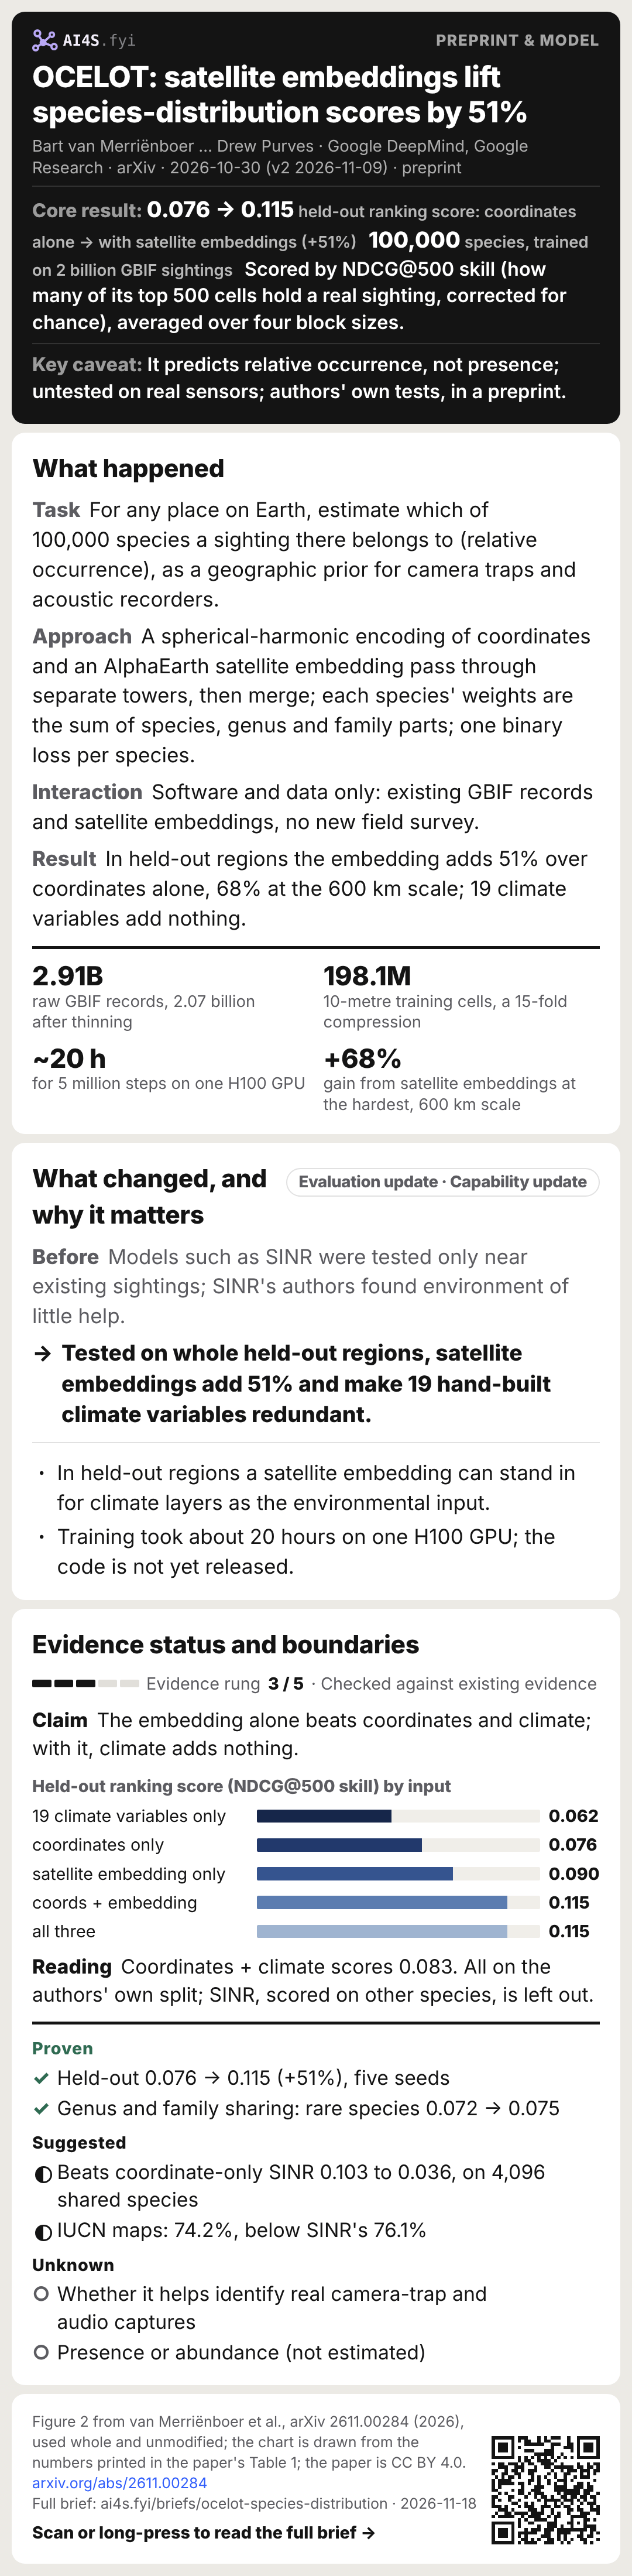
0.076 → 0.115held-out ranking score: coordinates alone → with satellite embeddings (+51%)
100,000species, trained on 2 billion GBIF sightings
Scored by NDCG@500 skill (how many of its top 500 cells hold a real sighting, corrected for chance), averaged over four block sizes.
- Belief update
- A general-purpose satellite embedding can stand in for hand-built climate layers, which tests near existing sightings could not show.
- Strongest validation
- Whole blocks 9 to 600 km wide removed from training, scored on the real sightings inside them, over five seeds.
- Key caveat
- It predicts relative occurrence, not presence; untested on real sensors; authors' own tests, in a preprint.
01What happened
- Task
- For any place on Earth, estimate which of 100,000 species a sighting there belongs to (relative occurrence), as a geographic prior for camera traps and acoustic recorders.
- Approach
- A spherical-harmonic encoding of coordinates and an AlphaEarth satellite embedding pass through separate towers, then merge; each species' weights are the sum of species, genus and family parts; one binary loss per species.
- Interaction
- Software and data only: existing GBIF records and satellite embeddings, no new field survey.
- Result
- In held-out regions the embedding adds 51% over coordinates alone, 68% at the 600 km scale; 19 climate variables add nothing.
2.91Braw GBIF records, 2.07 billion after thinning
198.1M10-metre training cells, a 15-fold compression
~20 hfor 5 million steps on one H100 GPU
+68%gain from satellite embeddings at the hardest, 600 km scale
The first version went up on arXiv (cs.LG) on 30 October 2026 and the second on 9 November, under CC BY 4.0, with the same abstract. Five of the seven authors list Google DeepMind and two Google Research; the contact is the first author, Bart van Merriënboer, and the last author is Drew Purves, Nature Lead at Google DeepMind. Purves wrote in his own LinkedIn post that the work builds on Cole et al.'s 2023 SINR, the basis of the iNaturalist geo model, and that the team looks forward to open-sourcing the model, code and global maps in due course; the paper itself says only that the authors plan to release the model weights.[S1][S2]
Relative occurrence: the question it answers
Citizen-science records say what was seen, not what was not, so a place with no record could be unsuitable or simply unvisited. The paper handles this with target-group background: assuming observation effort is roughly shared across species, conditioning on there being a sighting at a place cancels the effort, leaving the share of sightings that belong to each species, its relative occurrence. That reflects community composition, not whether a species is present or how many there are. The authors note that SINR treats such records as binary presence labels, which distorts probabilities in species-rich communities. The direct use is as a geographic prior for camera-trap or acoustic classifiers: the classifier says which species a capture looks like, OCELOT says which species usually occur here, and the two are multiplied.[S1]
How the data were processed
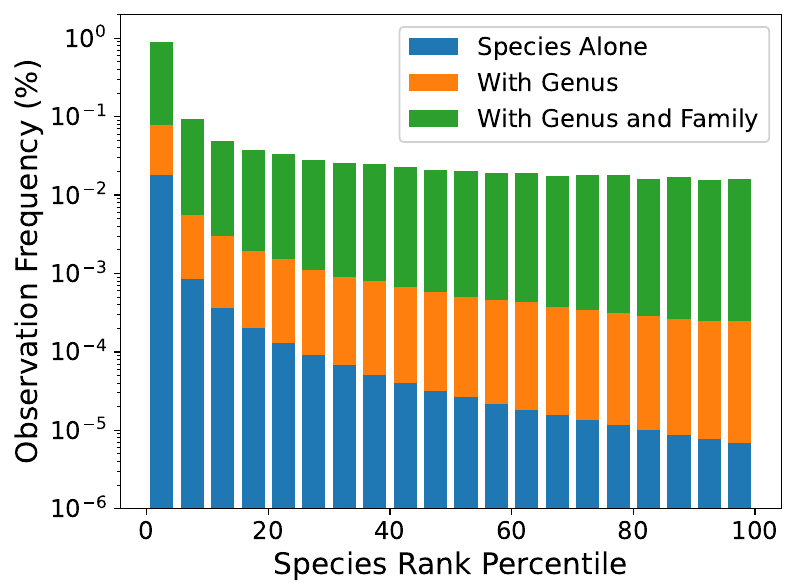
Training data are GBIF's September 2026 snapshot: after removing records with quality issues and matching names to the iNaturalist taxonomy, 2.91 billion records of 480,013 species. At most one record per species per day was kept in each cell of about 600 metres, a scale chosen from a space-time Simpson's diversity index, removing 838.7 million duplicates (28.8%) and leaving 2.07 billion; these were merged into 198.1 million multi-label training cells of about 10 metres. The vocabulary is the 100,000 most common species, covering 99.66% of sightings, with counts falling from 20.9 million for the first to 132 for the 100,000th. Because sightings per cell are heavy-tailed, weighting the loss by them makes training unstable, so cells are sampled instead; a tuned exponent of 0.5 (the square root of the count) sits between record-level and uniform sampling and gives heavily visited places less weight.[S1]
02What changed
Evaluation updateCapability updateModels such as SINR were tested only near existing sightings; SINR's authors found environment of little help.
Tested on whole held-out regions, satellite embeddings add 51% and make 19 hand-built climate variables redundant.
Why a different test
Sightings cluster where people go, while camera traps and acoustic recorders are increasingly placed in remote areas, exactly where records are sparsest. The authors argue that tests near existing sightings cannot tell a model that memorises where observers went from one that has learned the environment. So they cut the globe into S2 blocks at four scales, about 600, 150, 38 and 9 km, with 80% for training, 10% for validation and 10% for testing, and all training data inside a test block removed. The ranking metric is NDCG@500: how many of the model's top 500 cells hold a real sighting, with higher ranks weighted more, corrected against a random baseline into a skill score. For cost it is computed on about half a million held-out locations and a random sample of 4,096 species. The authors say SINR's finding that environmental data add little came from interpolation-only testing.[S1]
Table 1's results: coordinates alone 0.076, the 19 WorldClim climate variables alone 0.062, coordinates plus climate 0.083, the satellite embedding alone 0.090, coordinates plus embedding (OCELOT) 0.115, and all three still 0.115. The embedding alone beats coordinates and climate, and once it is in, the climate variables add nothing. The authors explain that AlphaEarth embeddings already encode location, elevation and climate. By scale, the embedding's gain is largest at the hardest, 600 km scale (+68%).[S1]
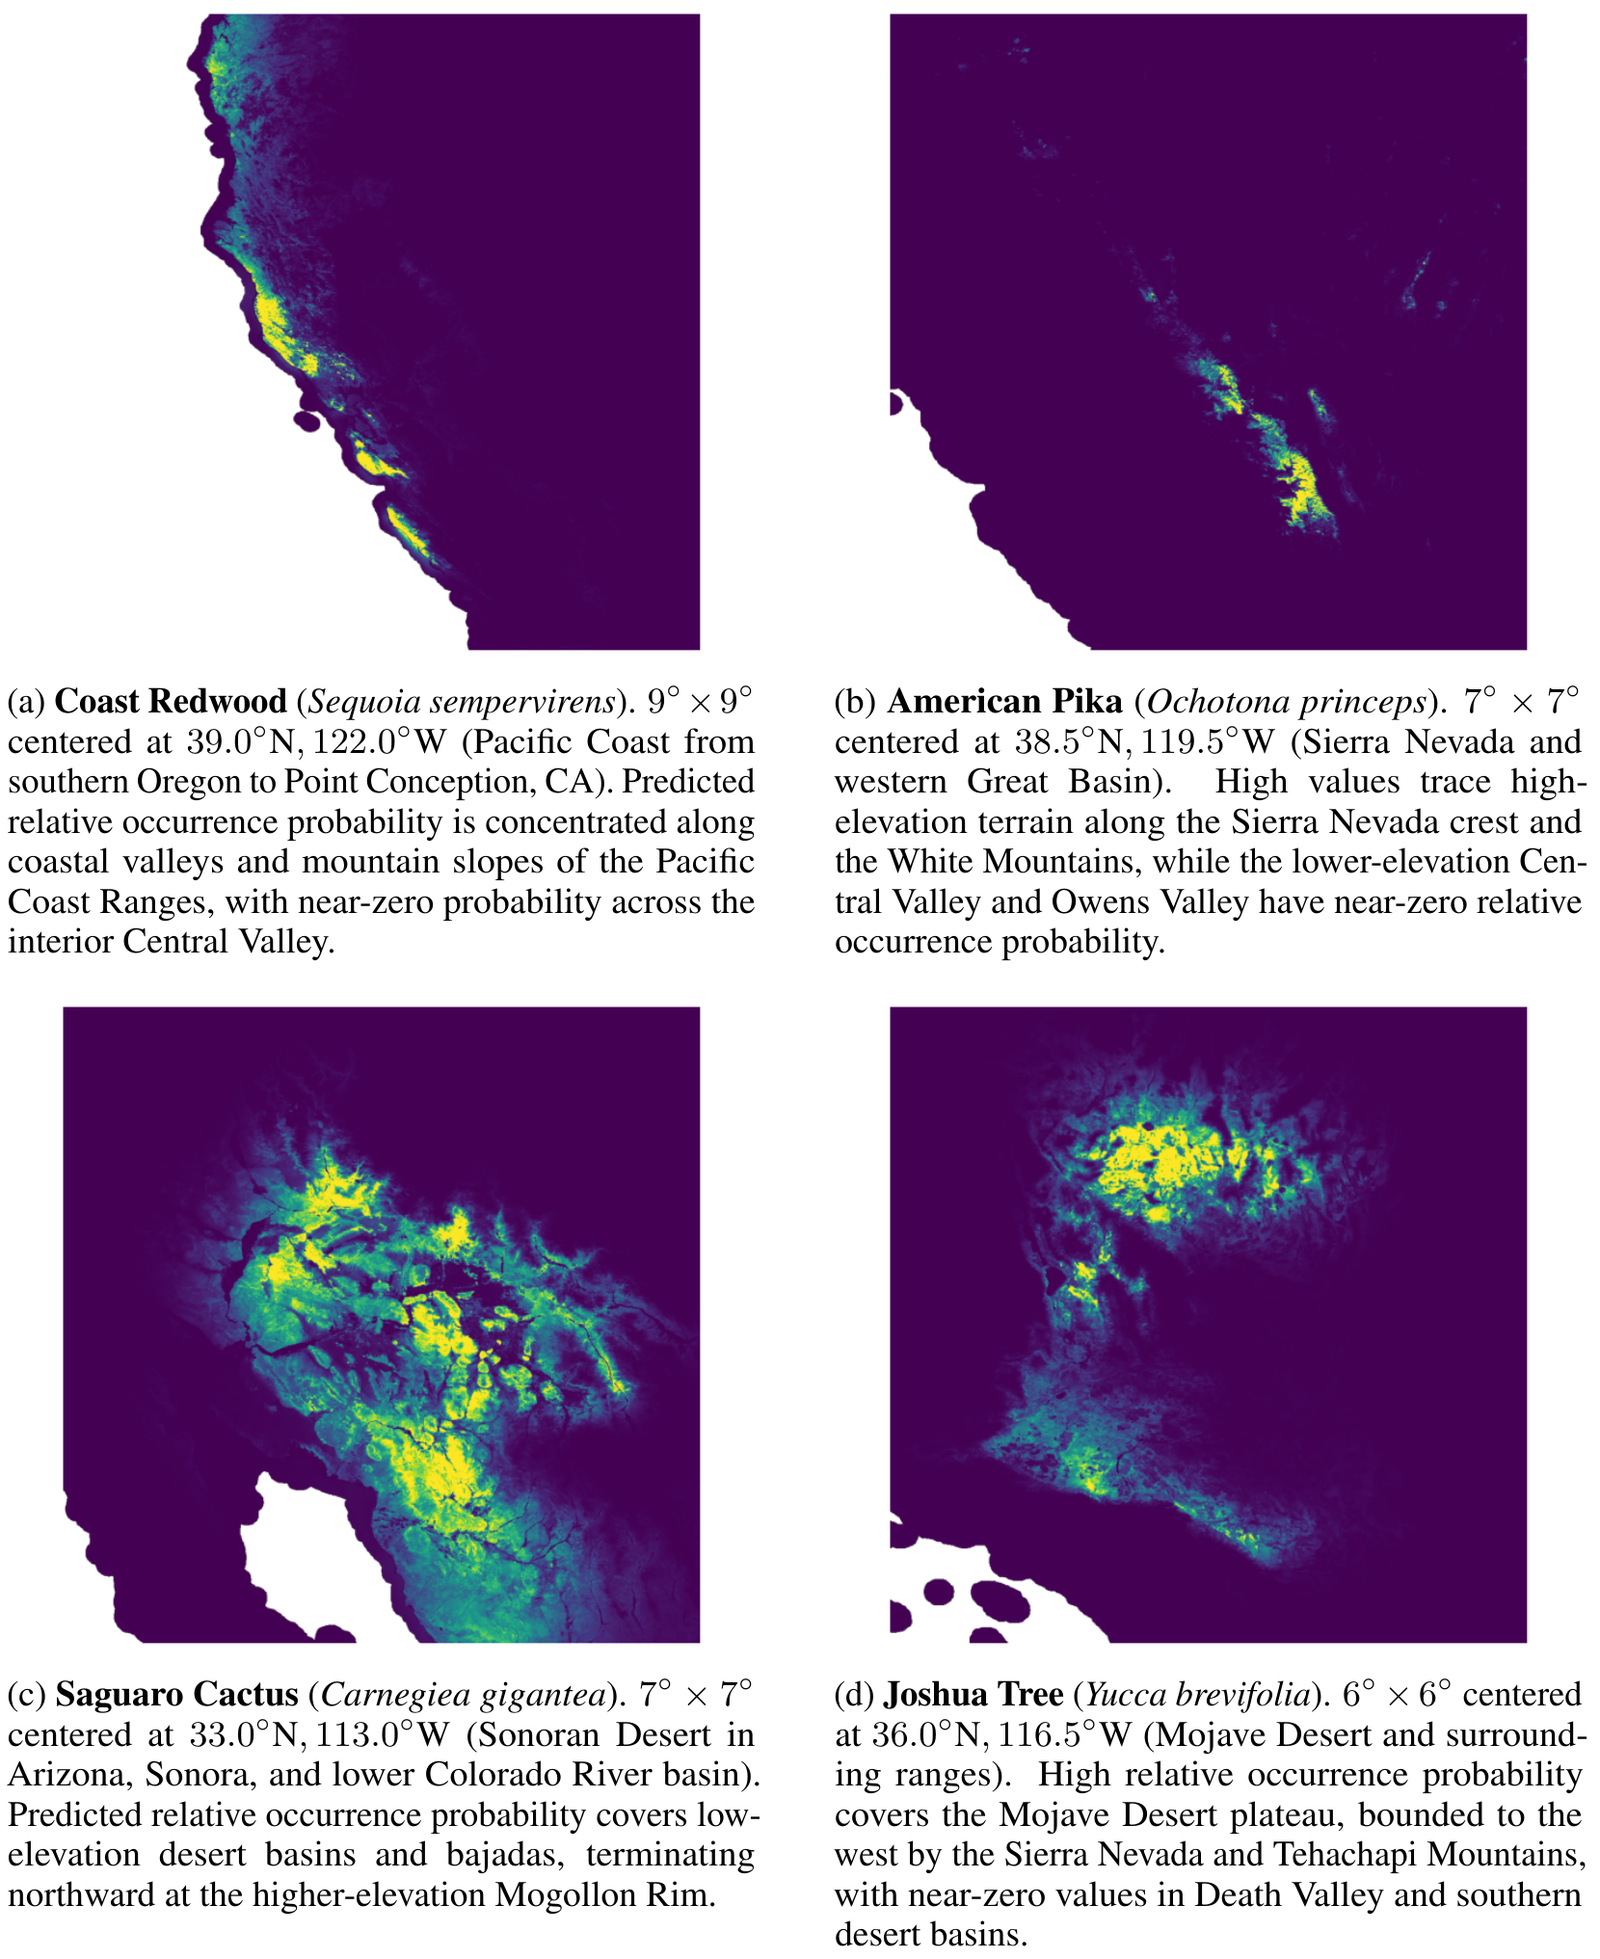
Figure 3: predicted relative occurrence for four species of western North America (coast redwood, American pika, saguaro and Joshua tree), with the authors' notes on each map. Warm yellow is high relative occurrence, dark blue near zero. [S1]
03Why it matters
Monitoring teams can use a global model like this as the geographic prior for camera-trap and acoustic identification.
- In held-out regions a satellite embedding can stand in for climate layers as the environmental input.
- Training took about 20 hours on one H100 GPU; the code is not yet released.
Purves writes in his post that, as a global model trained on open data subject to biases, OCELOT's outputs should be seen as a hopefully useful, data-informed prior rather than the final answer, and that the team expects and hopes users will calibrate, refine or threshold them with local data and expertise. The paper's ethics statement notes that high-resolution distribution predictions carry the risk of locating endangered species for poachers; GBIF generalises the locations of flagged sensitive taxa, and OCELOT inherits that protection.[S2][S1]
04Evidence status and boundaries
Evidence rung 3 / 5 · Checked against existing evidenceEvidence status
Proven
- Held-out 0.076 → 0.115 (+51%), five seeds
- Genus and family sharing: rare species 0.072 → 0.075
Boundaries
Suggested
- Beats coordinate-only SINR 0.103 to 0.036, on 4,096 shared species
- IUCN maps: 74.2%, below SINR's 76.1%
Unknown
- Whether it helps identify real camera-trap and audio captures
- Presence or abundance (not estimated)
ClaimThe embedding alone beats coordinates and climate; with it, climate adds nothing.
Held-out ranking score (NDCG@500 skill) by input
ReadingCoordinates + climate scores 0.083. All on the authors' own split; SINR, scored on other species, is left out.
On the interpolation benchmarks.
The authors also ran SINR's three benchmarks: as a geographic prior for image classification, OCELOT's top-1 accuracy is 86.4% (SINR 81.9%); on eBird range maps for 535 North American birds, mean average precision 83.22% (SINR 80.48%); on IUCN expert range maps for 2,418 species, 74.16%, below the 76.07% of SINR with environmental inputs. The authors say the eBird and IUCN tests score binary range prediction, which OCELOT was not trained for, and that IUCN polygons are coarse extent-of-occurrence envelopes that penalise fine habitat discrimination, which is why coarse climate variables edge out the satellite embedding there.[S1]
Why the comparison with SINR is only partial.
SINR supports different species from OCELOT, so the held-out comparison uses only the 4,096 species both support: OCELOT 0.1034 against 0.036 for coordinate-only SINR. The authors state that no SINR checkpoint with environmental inputs was available, so that version did not take the held-out test. The paper also notes that OCELOT differs from earlier models in training data, architecture and loss, so the gap cannot be put down to any one design choice.[S1]
The limits the authors state.
The model has no time dimension: seasonal migration, phenology and long-term range change are not modelled. Satellite embeddings are latent vectors, not physical quantities like climate variables, so attributing a prediction to an environmental driver needs post-hoc probing. The system is one static model with no clear way to add expert observations or new species without retraining. Next steps include phenology, evaluation on real deployment data, and more taxa and regions.[S1]
05What I learned
- Transferable insight
- The test changes the conclusion: the same environmental data look useless when interpolating and add 51% on held-out regions.
- Design heuristic
- Weights summed over species, genus and family let a rare species with a hundred-odd records borrow its relatives' training signal.
- Reading heuristic
- On seeing a high distribution-model score, ask whether it was tested near existing sightings or on held-out regions.
- Watch next
- The weights and global maps released; gains on real camera-trap or acoustic identification; an outside group's replication.
As one imageTo save and share→Sources
Factual claims link to original announcements, project lists, trial records or journal papers where possible. Research plans are kept separate from completed results.
- S1OCELOT: Planetary-Scale Species Distribution Modeling with Satellite Foundation EmbeddingsarXiv 2611.00284 · van Merriënboer … Purves · 2026.10.30 · Preprint v2 · CC BY 4.0 · main text and appendices A to C read
- S2Drew Purves's LinkedIn post introducing OCELOT (linked to his profile)LinkedIn · Drew Purves · 2026.11.17 · The author's own post, as text the editor pasted